Blog

Rewriting R Functions in C
A guide to using the C API with R to improve performance by rewriting vector operations.
AUG 26 2024
Read More 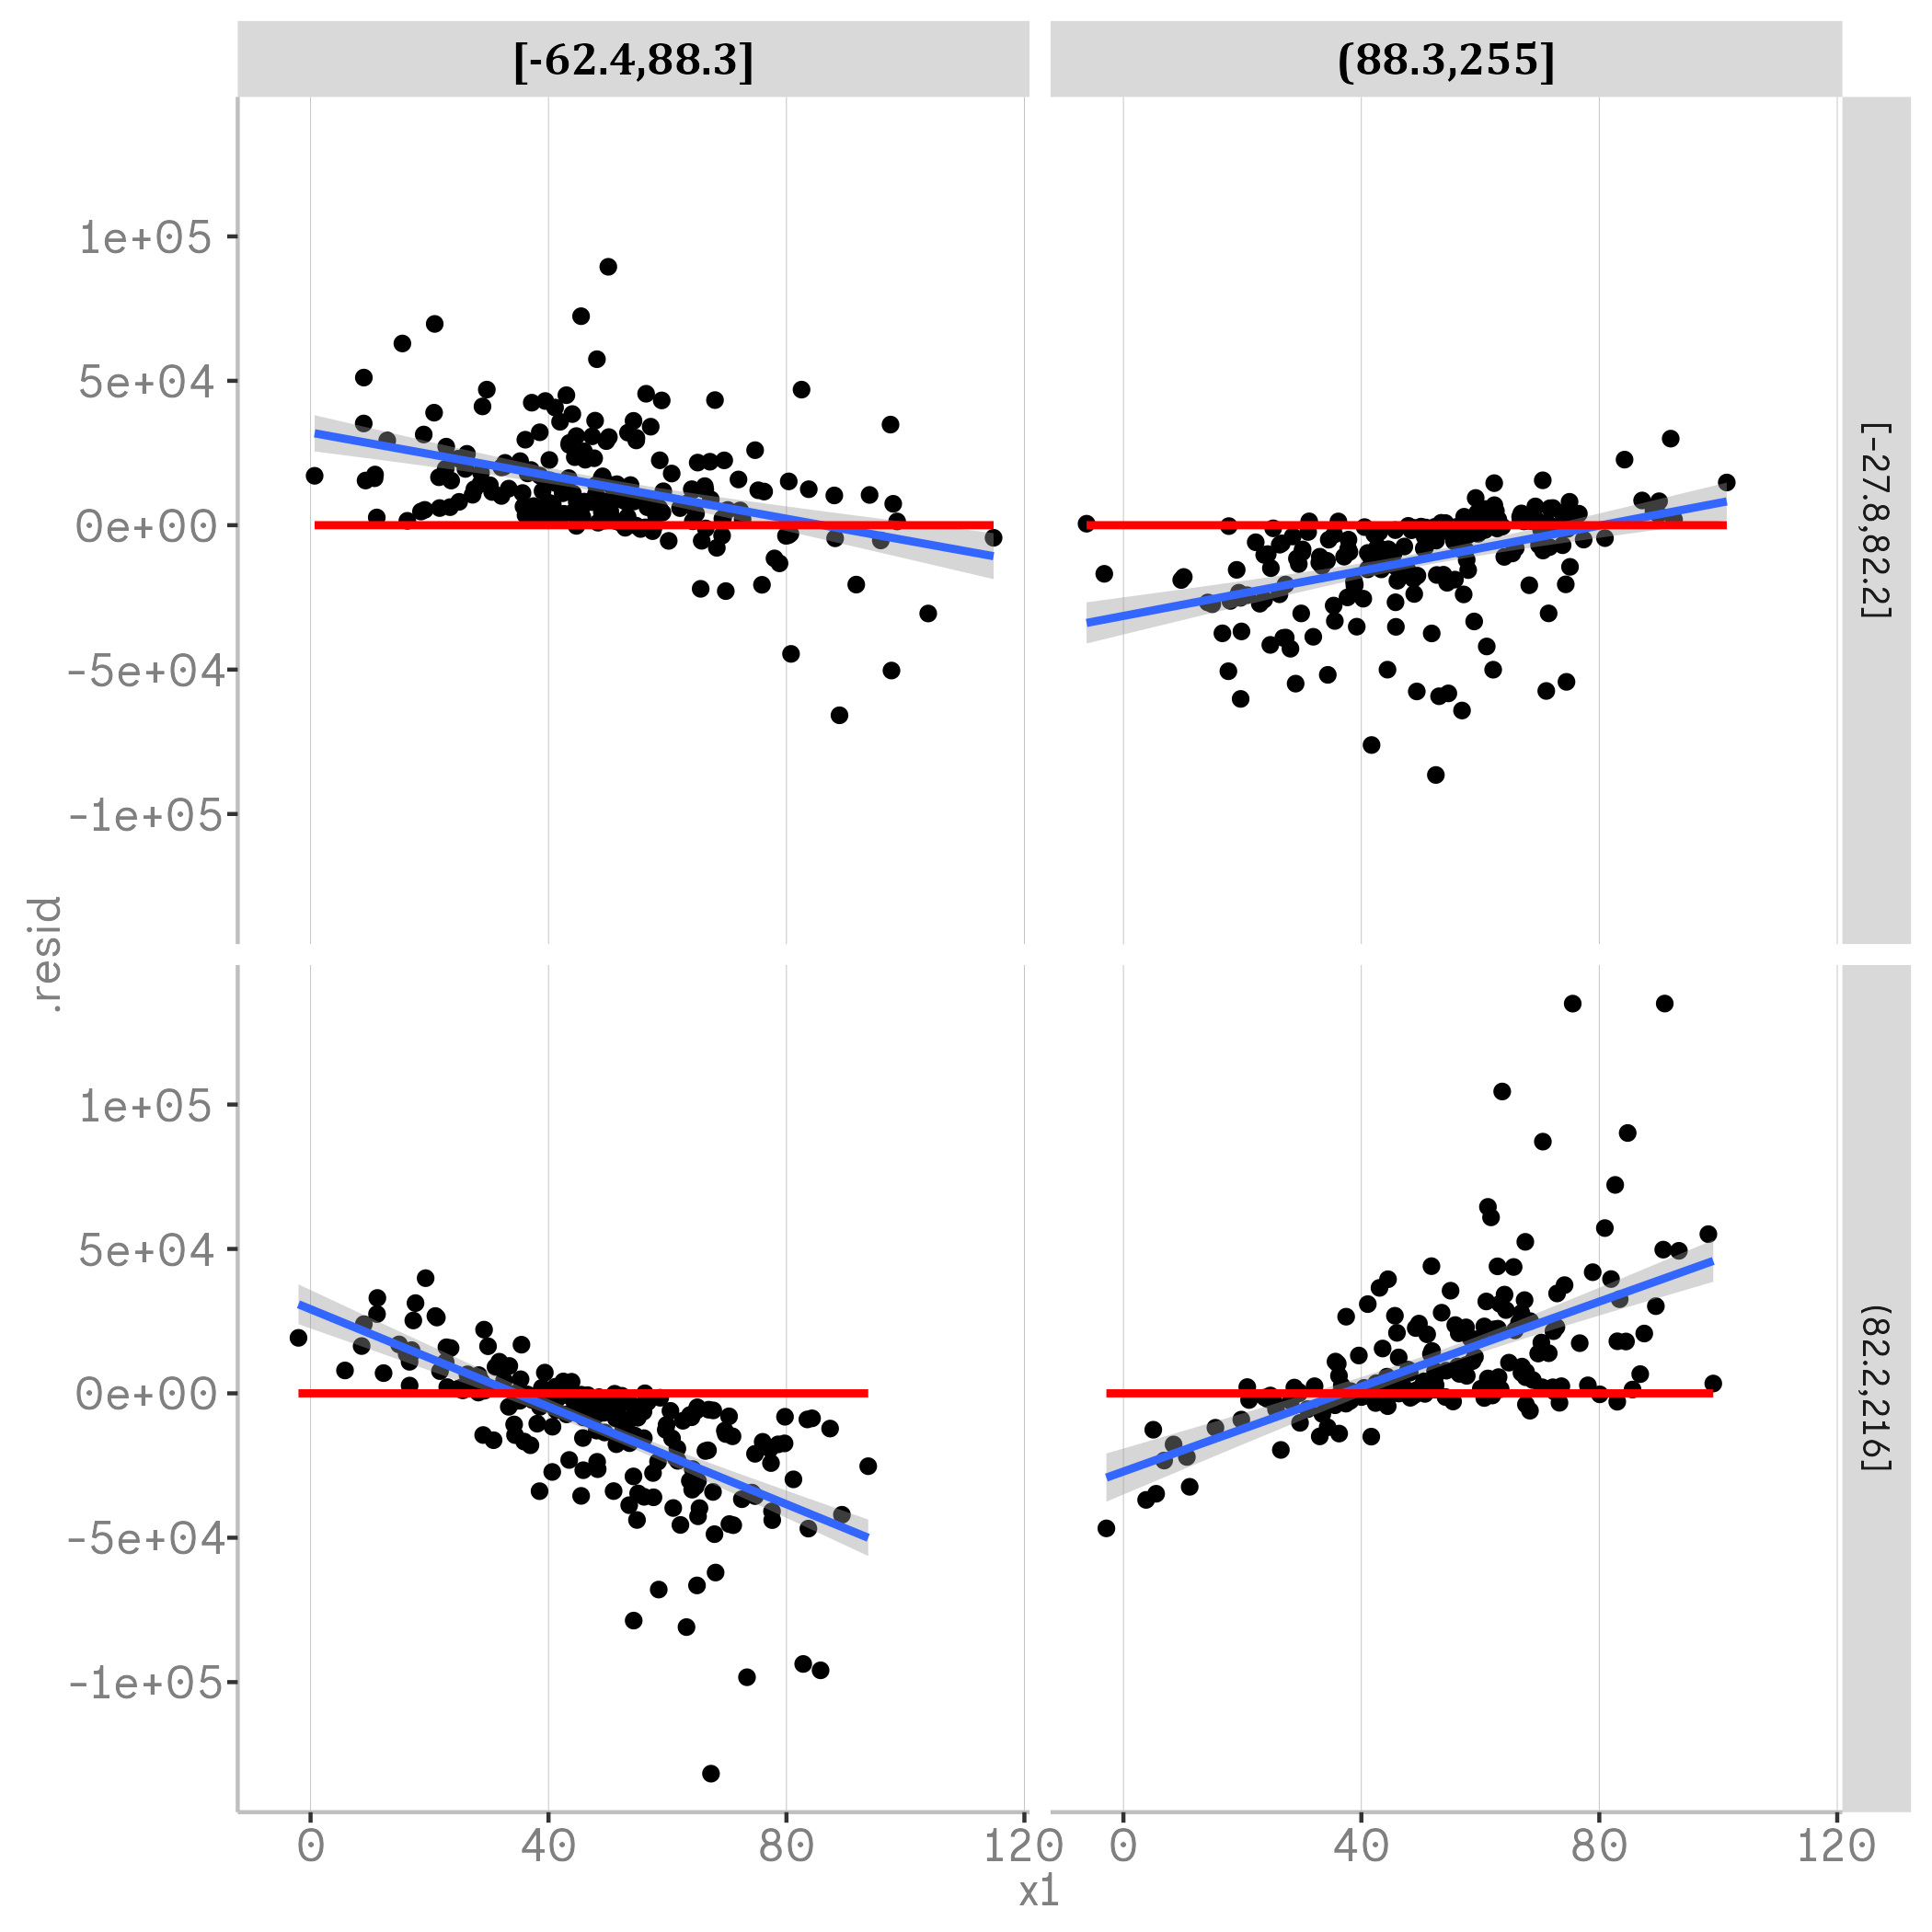
Introduction to partial residual plots
Partial residual plots can give you valuble information about your model and relationships in the data like interactions and nonlinear trends. In this post we look at use cases and different ways PRP can be created in ggplot.
JUN 15 2024
Read More 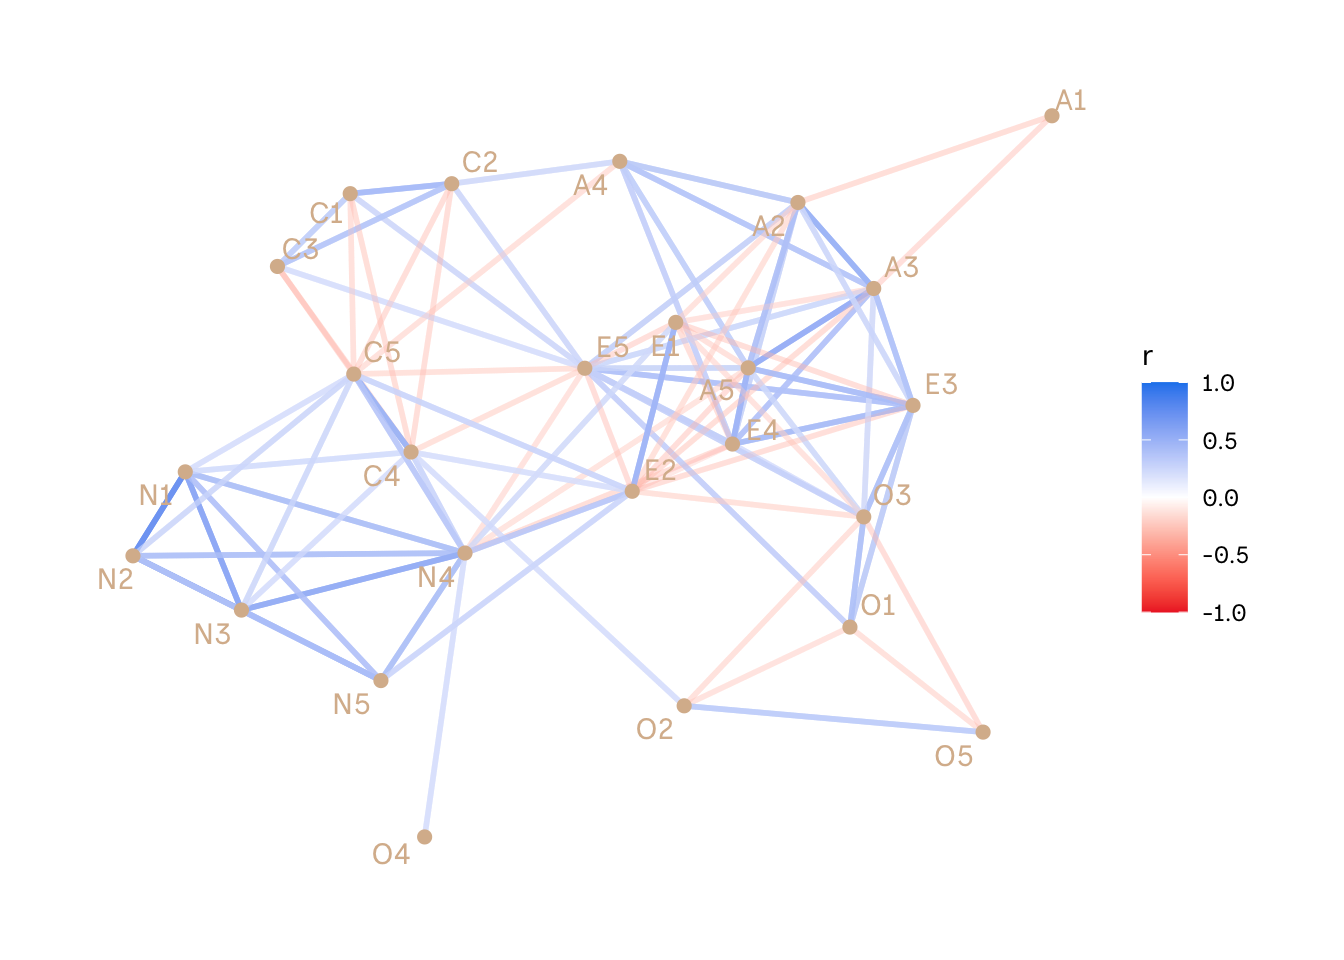
Correlation Networks in R
Plotting correlations as networks can give you a good first impression of the interconnectivity of your variables. This is a quick tutorial on how to create correlation networks in R.
JUN 12 2024
Read More 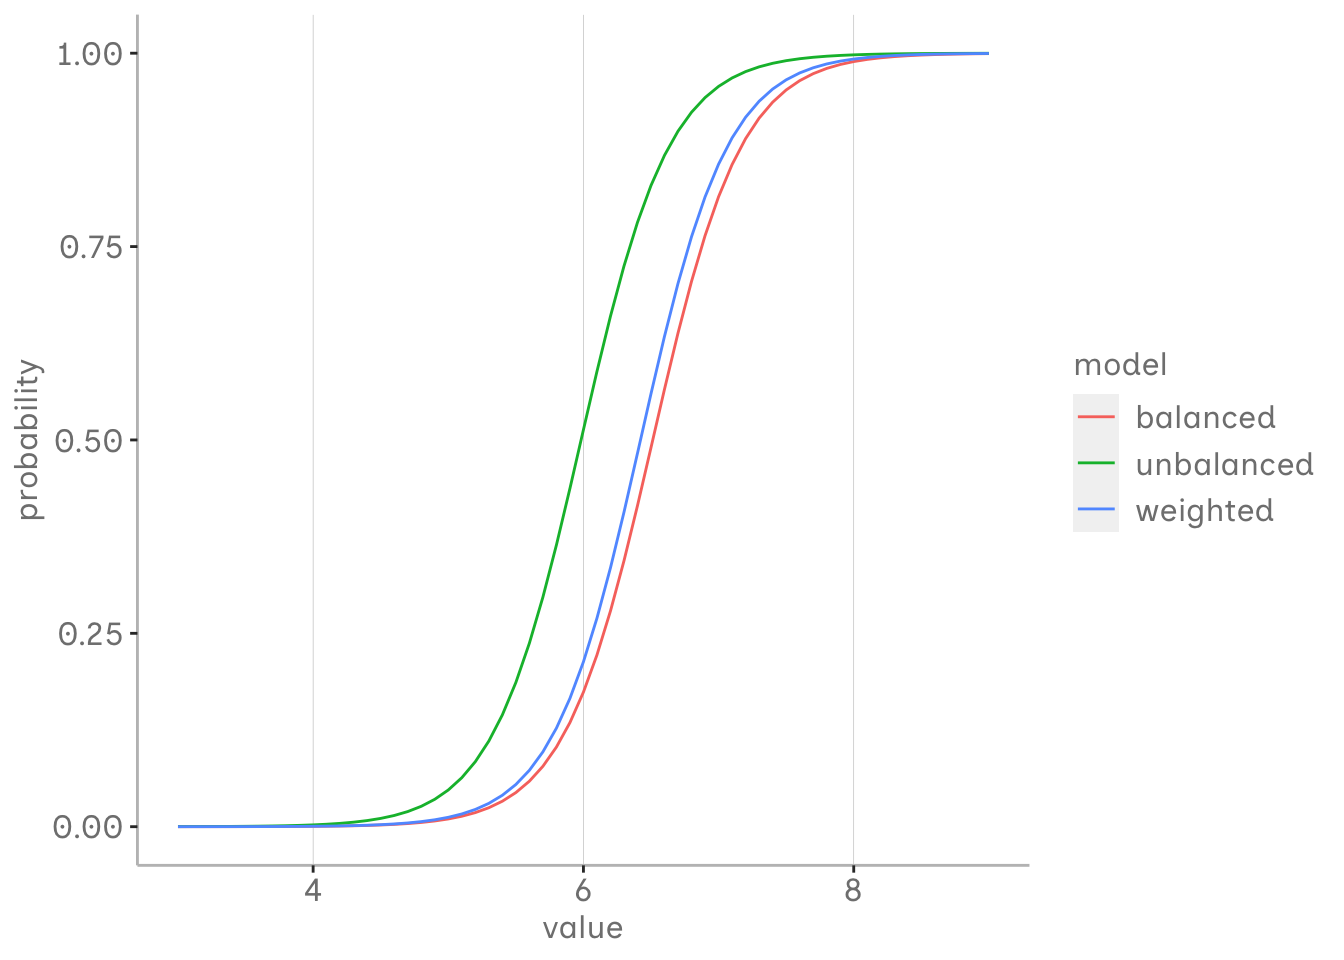
Exploring frequency weights in logistic regression
Frequency weights can be used in logistic regression to address class imbalance caused by sampling bias. In this post, we will use simulations to explore how to effectively choose weights and visually understand the benefits of this approach.
JUN 04 2024
Read More